

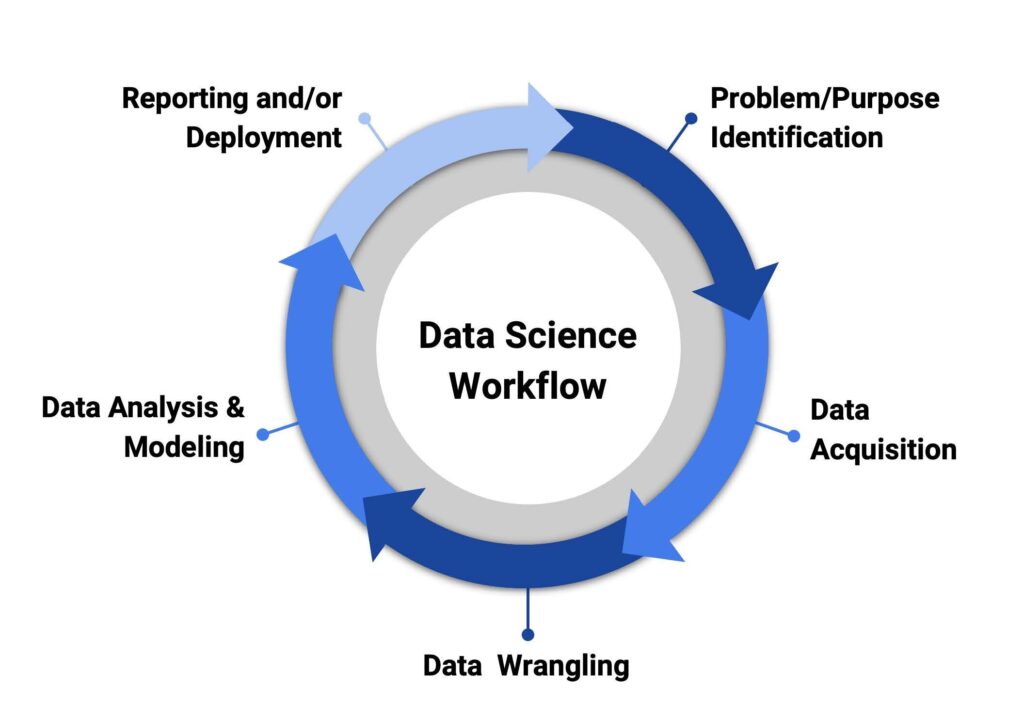
The study of data science is focused on drawing conclusions and knowledge out of data. It involves analysing and interpreting vast amounts of data using statistical and computer methods. Data science workflow is crucial for effective completion of data science initiatives. Data science workflow offers a structure for planning and carrying out data science tasks in a methodical and effective way. One of the most widely used computer languages for data science is Python. It offers many tools and frameworks that make working with data simple. We will outline a step-by-step approach for data science workflow using Python in this blog article.
Stage 1: Problem Defining:
The first step in the data science workflow is defining a problem. This entails figuring out the business issue that the data science project is meant to address. Because it establishes the direction for the entire project, this step is crucial. The project’s goals, data sources, and data quality must all be understood during the problem definition stage. You should enquire about the issue by asking questions like:
- What specific business issue are we attempting to resolve?
- What are the project’s objectives?
- What data do we need to solve the problem?
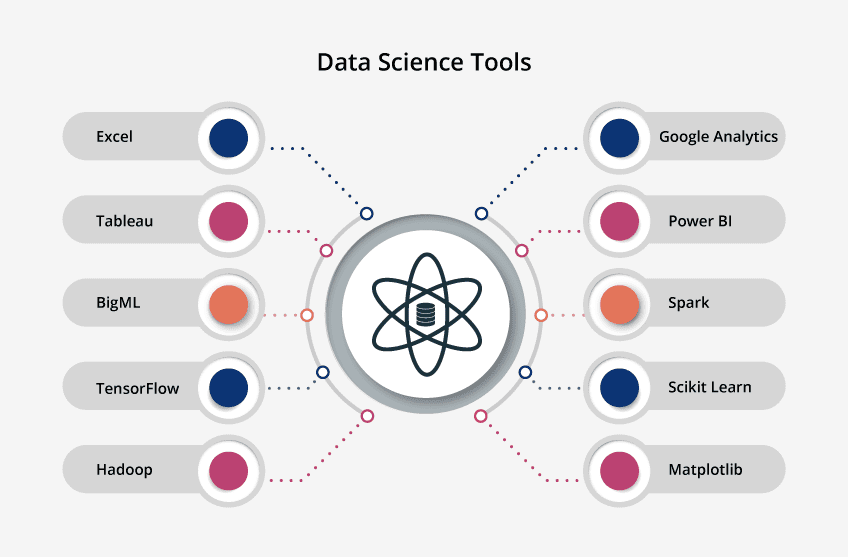
Some of the tools used for defining a problem in data science workflow include:
- Data scientists can create and share documents with live code, equations, graphs, and narrative text using the open-source web application Jupyter Notebook.
- Google Colab: This is a free Jupyter Notebook hosted in the cloud that has a GPU and enables collaboration and notebook sharing for data scientists.
- Microsoft Excel is a spreadsheet application used for data organisation and analysis. It is helpful for displaying data and for doing simple data analysis tasks.
Stage 2: Data collection:

The second step in data science workflow is data collection when the problem has been identified. This entails acquiring the project’s pertinent data. The stage of data gathering might be difficult since data may be dispersed across several sources and in various forms. Finding the sources of the data, extracting the data, and cleaning the data to get rid of any mistakes or discrepancies are all steps in the data collection process. Data may come from a variety of sources, including databases, APIs, and web scraping.
Tools used for data collection step of data science workflow are:
- Web scraping tools: These devices are employed to gather information from websites. BeautifulSoup and Scrapy are two well-liked online scraping applications.
- APIs: Several websites and platforms offer data-extracting APIs. Facebook, Google Maps, and Twitter are a few popular APIs.
- Databases: Databases like MySQL, PostgreSQL, and MongoDB can be used to store data. It is possible to access and modify data in databases using programmes like Navicat and MySQL Workbench. You can use Python tools like pandas, numpy, and requests to read the data. Pandas, for instance, can be used to read data from a CSV file:

Stage 3: Data preparation:
The next step after data collection in data science workflow is data preparation. This entails converting the data into an easily-analyzed format. Data cleansing, data integration, data transformation, and data normalisation are all part of the data preparation stage. Creating a clean, uniform data set that can be used for analysis is the aim of the data preparation stage. You can utilize Python libraries like Pandas, NumPy, and SciPy to prepare the data.

Some of the tools used for data preparation step of the data science workflow include:
- Python libraries: Data translation, cleaning, and manipulation are done with the help of libraries like Pandas
- OpenRefine is a free open-source utility for converting and cleaning up unorganised data. It can be used for things like standardising, parsing, and cleaning up data.
- Trifacta: Trifacta is a platform for data preparation that enables large-scale data exploration, cleaning, and transformation. It has capabilities including suggestions based on machine learning, visual data manipulation, and data quality evaluations.
- KNIME: Users may build data pipelines for data integration, transformation, and analysis using this open-source data analytics platform. It contains a variety of nodes for data preparation that may be applied to operations including data cleaning, filtering, and transformation.
- Talend: it is a data integration and management platform that includes various tools for data preparation including data profiling, data quality testing, and data cleaning.
- Apache Spark: Apache Spark is a data preparation framework that comes with a number of tools, including Spark SQL, which is useful for data translation and manipulation.
Stage 4: Data exploration:
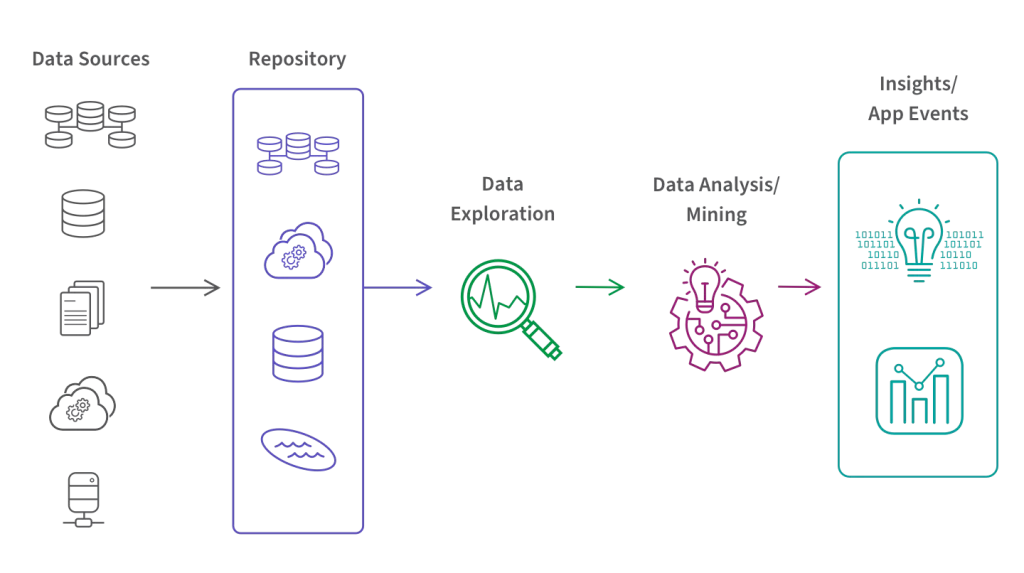
In data science workflow, data exploration comes after the data has been prepared. To do this, the data must be examined for insights and trends. Data visualisation, statistical analysis, and machine learning techniques are all part of the data exploration step. Finding intriguing patterns in the data that can be used to solve the business challenge is the aim of the data exploration stage. Various Python packages such as matplotlib, seaborn, and scikit-learn are used to investigate the data. For illustration, you may display the data using matplotlib.

Tools for data exploration used in data science workflow are:
- Tableau, Power BI, and QlikView are a few well-liked data visualisation programmes.
- Python libraries including Matplotlib, Seaborn, and Plotly.
- Statistical analysis software including R, SPSS, and SAS.
Stage 5: Data modelling:
Data modelling is the next step in data science workflow after the patterns have been found. This entails creating a model that may be applied to forecast future events or categorise fresh data. Tasks like feature engineering, model selection, and model evaluation are part of the data modelling stage. Building a reliable and accurate model that can be used to solve the business problem is the aim of the data modelling step. You can use Python tools like scikit-learn, tensorflow, and keras to create the model. For instance, scikit-learn can be used to create a decision tree model:

Tools for Data modelling step in data science workflow include:
- Python libraries: Machine learning and deep learning require libraries like Keras, TensorFlow, and Scikit-Learn.
- R: For statistical computation and graphics, R is a programming language.
- SAS: SAS is a commercial software package used for predictive modelling and data analytics.
Stage 6: Deployment:
In data science workflow, deployment comes after the model has been constructed. This entails putting the model into use and incorporating it into the operational procedures. Model testing, model maintenance, and model integration are all duties that fall under the deployment phase. The deployment stage’s objective is to confirm that the model is operating as planned and providing value. Use Python packages like flask, django, and fastapi to deliver the model.
Tools used in deployment stage in data science workflow are:
- Flask: A micro web framework for creating RESTful APIs, flask.
- Django: For creating sophisticated online applications, Django is a high-level web framework.
- AWS: Amazon Web Services (AWS) offers a range of services for setting up and controlling cloud-based applications.
Stage 7: Inspection and upkeep:
Monitoring and upkeep are the workflow’s last phase in data science workflow. This entails keeping an eye on the model’s performance and making any necessary modifications. Model retraining, model optimization, and performance monitoring are all part of the monitoring and maintenance phase. The monitoring and maintenance phase’s objective is to make sure the model keeps adding value to the company’s operations throughout time.
Tools used in monitoring and maintenance in data science workflow include:
- ELK Stack: Popular open-source log analysis platform ELK (Elasticsearch, Logstash, and Kibana). It can be used to gather and analyse log data from the deployed system to keep track of the performance of models.
- Grafana: A well-liked open-source platform for tracking and visualising metrics from many sources, Grafana. It can be used to track the effectiveness of models by displaying metrics like recall, precision, and accuracy.
- TensorBoard: TensorBoard is a web-based application offered by TensorFlow that allows users to visualise and track the functionality of machine learning models.
- Prometheus is a well-known open-source monitoring system that is useful for gathering and storing metrics from many sources in order to track the performance of models.
- Nagios: Nagios is a well-known open-source monitoring and alerting tool. It can be used to keep an eye on a model’s performance and notify users if there are any problems.
In conclusion, for each stage of the data science workflow, from problem description to monitoring and maintenance, there are numerous tools accessible. These technologies can allow data scientists to optimise their workflow, automate tedious operations, and focus on the most important aspects of their work, which is acquiring insights and addressing real-world problems through data analysis, machine learning, and statistical modelling.
Frequently asked question:
Question 1: How do you validate the accuracy of a model in the data science workflow?
Answer: In data science workflow model’s accuracy can be verified using a variety of techniques, such as:
1. Splitting the dataset into two parts, a training set and a testing set, according to the train-test method. The training set is used to develop the model, and the testing set is used to assess it. The model’s accuracy is then evaluated by comparing the predicted values with the actual values in the testing set.
2. Cross-validation: This method involves dividing the dataset into several folds and training and validating the model on each fold.
3. Holdout validation: This technique divides the dataset into three sections: training, validation, and testing sets. Training set is used to train the model, the validation set is used to tune the hyperparameters and the accuracy of the model is measured on the test set.
4. Bootstrap: This method entails extracting several samples from the dataset with replacement and training the model on each sample. The accuracy of the model is checked by averaging the performance of all the samples.
5. A/B testing: This technique compares the model under test to an existing system or a baseline model to see if it performs better or worse.
6. Metrics like accuracy, precision, recall, F1-score, and ROC curve can be used to assess a model’s degree of correctness.
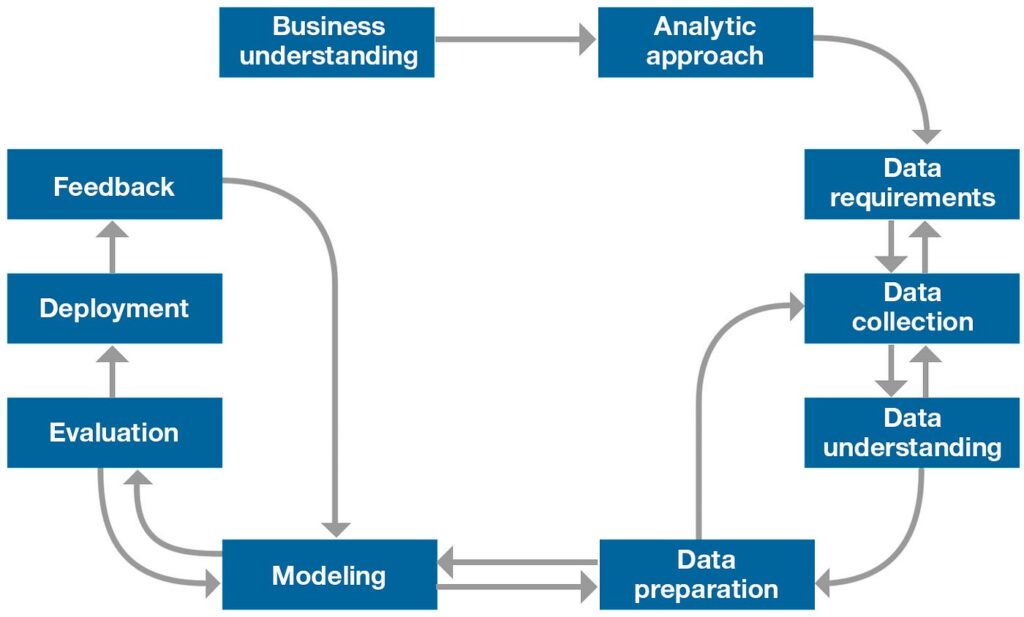
Question 2: What are the main stages of the data science workflow?
Answer: There are main seven stages in data science workflow including:
- Data Collection
- Data Preparation
- Exploratory Data Analysis (EDA)
- Feature engineering
- Modelling
- Model Evaluation
- Model Deployment
Question 3: Why is data cleaning important in the data science workflow?
Answer: Data cleaning is a vital step in the data science workflow since it helps to guarantee the correctness, dependability, and consistency of the data used in modelling and data analysis. These are some reasons for why data cleaning is crucial:
- Ensure data quality: Data cleansing helps to eradicate errors, inconsistencies, and inaccuracies from the data.
- Data cleaning helps to remove outliers, missing values, and other data irregularities that can influence the outcomes of data analysis, which increases analysis accuracy.
- Improve data consistency by removing duplicate items and standardising data style.
- Boost productivity: Data cleaning makes the data analysis process more efficient by removing errors and inconsistencies. As a result, data scientists can focus more of their time on analysis and modelling rather than cleaning and preparing data.
Question 4: How do you choose the appropriate data analysis technique in the data science workflow?
Answer: To select the best data analysis technique in the data science workflow, a thorough grasp of the issue at hand, the nature of the data and the specific research questions to be addressed is necessary. The following stages can help you choose the best data analysis methods:
- Specify the research inquiries
- Determine the type of data
- Take into account the data distribution
- Take into account the sample size
- Choose appropriate analysis techniques
- Verify the selected technique
Question 5: How do you communicate the results of the data science workflow to stakeholders?
Answer: Communicating the results of the data science workflow to stakeholders is an important phase. These are some actions to help in communication:
- Identify your audience
- Simplify the findings
- Give context: Explain the business problem, the data used, and the methodologies used to put the results into context.
- Employ visual aids: To explain the findings, use visual aids like charts, graphs, and tables.
- Tell a story: To communicate the findings and their implications, use narrative approaches.
- Provide practical suggestions: Lastly, depending on the analysis’s findings, offer practical suggestions. This can aid the stakeholders in comprehending how to put the findings into practise and get the results they want.