Introduction
The increasing need for people with advanced Excel skills in a variety of professional roles—such as financial analysts and data scientists—is covered in this article. The top 30 advanced Excel interview questions and answers provide a comprehensive resource for those preparing for interviews or enhancing their skills. PivotTables, Visual Basic for Applications, complex formulas, and data visualization are all covered in the - advance excel interview questions in this article. This article therefore offers a holistic view of the skills required for data related roles, from understanding intricate functions to automating tasks through scripting. The compiled advance excel interview questions not only aids candidates in preparation for interviews but also serves as a helpful tool for continuous skill development.
Advance excel interview questions on basic concepts
- Q1: What are PivotTables and how do you use them in Excel?

Excel interviews can be started with advance excel interview questions such as this and your answer sets the tone for the interview. With the use of pivot tables, users of Excel data analysis tools can efficiently summarize sizable datasets by rearranging and compiling specific columns and rows. Pivot tables organize, reorganize, and summarize data so Excel users can draw insightful conclusions. Users can alter the appearance, filter, sort, and refresh data as needed. PivotTables improve data-driven insights and decision-making.
- Q2: What is the difference between a relative and absolute cell reference in Excel?
Excel locates and identifies cells using cell references. Absolute references stay the same, but relative references change according to where the copied formula is located. Combining the two, mixed cell references either fix the row or the column. Developing dynamic formulas requires an understanding of and utilization of relative and absolute cell references, particularly in intricate worksheets or large datasets.
- Q3: How do you apply conditional formatting in an Excel sheet?
This is one of the most asked advance excel interview questions as this subject is rather popular. Excel's conditional formatting feature is a potent tool that enhances data visualization by enabling you to format cells according to particular criteria or conditions. Selecting a range of cells, going to the "Home" tab, clicking on "Conditional Formatting," selecting a formatting rule, a style, adjusting settings, previewing and applying, and managing rules are the steps involved in applying conditional formatting.
- Q4: Describe the function and usage of the IF statement in Excel.
Excel's IF statement is a logical function that automates decision-making processes by carrying out conditional evaluations based on predetermined criteria. IF statement in Excel supports error handling, data cleansing, dynamic data display, conditional formatting, and calculation modifications. Error handling, dynamic data display, cell highlighting, and calculation adjustments are some of the main applications. Making dynamic and responsive Excel spreadsheets requires it.
- Q5: What are some common uses of the VLOOKUP function?

Excel's VLOOKUP function is an effective tool for finding particular values in a table or range and retrieving matching values from an adjacent column. It is used for data retrieval, index-match replacement, approximate match, exact match, error handling, and dynamic range expansion. The VLOOKUP is usually useful for working with structured datasets and it is an important tool in data analysis and reporting.
Advance excel interview questions on data analysis and reporting
- Q6: How do you handle large datasets in Excel?
Advance excel interview questions data analysis and reporting cannot be overlooked. Excel Tables, filtering, sorting, creating PivotTables, applying conditional formatting, applying data validation, consolidating data, using 64-bit Excel, optimizing formula efficiency, switching to manual calculation, minimizing data range optimization, connecting Excel to external data sources, compressing repetitive data, and routinely saving backups are some of the methods that can be used to handle large datasets in Excel. For advanced data manipulation, consider tools like Power Pivot and Power Query. These strategies enhance Excel's performance and efficiency.
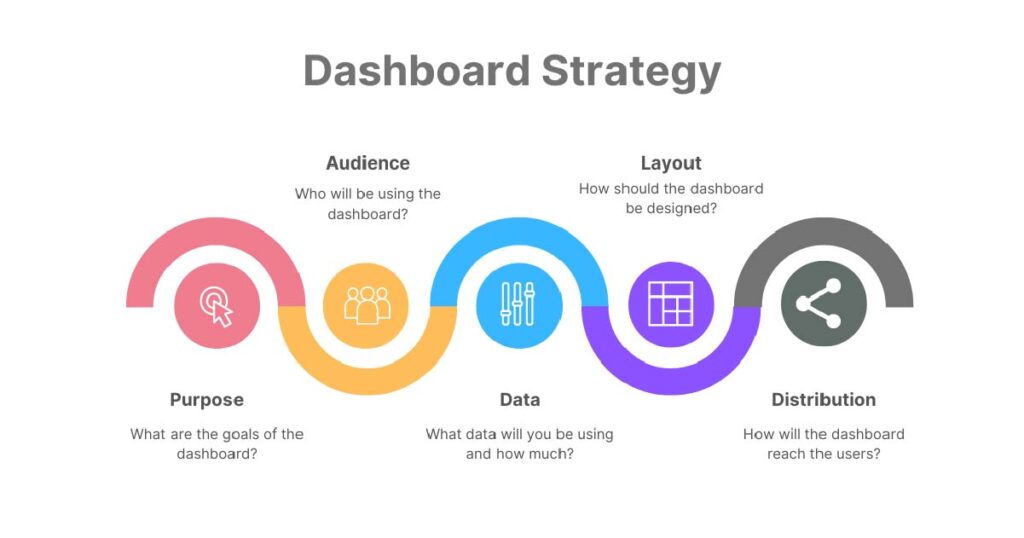
- Q7: Describe how to create a dashboard in Excel.

Key data from multiple sources is visually presented in an Excel dashboard. Goal-setting, data collection, layout design, visual element selection, chart and graph insertion, PivotTable addition, slicer and filter integration, text box and label insertion, conditional formatting, navigation structure creation, design testing and refinement, and dashboard protection are all part of it. This process helps in presenting key insights and metrics effectively, facilitating quick decision-making.
- Q8: What are Excel slicers and how do they work?
PivotTables, PivotCharts, and Excel tables can have data filtered and analyzed by users using Excel slicers, which are interactive visual controls. They provide a user-friendly way to manipulate data without navigating through filter dropdowns or dialog boxes. To use the slicer, first create an Excel Table, PivotTable, or PivotChart. Then, insert the slicer, select the fields you want, format and arrange them, and use them with Excel Tables.
- Q9: Can you explain the process of data consolidation in Excel?
This is also one of the frequently asked advance excel interview questions. When handling distributed data across several worksheets, workbooks, or ranges, Excel's data consolidation feature can be helpful as it merges data from several sources into a single sheet or range. To merge data from several sheets or workbooks, start a new worksheet, choose the destination range, click "Consolidate," choose the consolidation function, include range references, set up the options, and hit "OK."
- Q10: How do you use Excel for financial analysis?
Excel is a powerful tool for financial analysis, offering various functions and features to handle and interpret financial data. To use first create a well-organized worksheet, then use the basic arithmetic functions for calculations and aggregations. Then you utilize the financial function, explore the built-in templates for budgeting racking expense etc., apply data validation to ensure the entry is accurate, use the pivot tables to analyze the data, create charts to visualize the data, use scenario manager to create and compare input values, apply goal seek for what- if analysis, utilize the solver add-in, create table for sensitivity analysis, use power query to clean and transform the data, build financial reports by organizing the data into financial statement, then audit and formulate formulas and finally use passwords to protect financial models.
Advance excel interview questions on functions and formulas
- Q11: What is the INDEX/MATCH function and how does it differ from VLOOKUP?
The VLOOKUP function can be replaced with the more capable and versatile INDEX/MATCH function combination in Excel. Its versatility comes from allowing both row and column matching. The direction of lookup, column selection, error handling, multiple criteria, and performance are some of the key variations. Because of its enhanced error handling, flexibility, and capacity to accommodate changes in column positions, INDEX/MATCH is recommended.
- Q12: Explain array formulas and their advantages.
Advance excel interview questions can be set on this area hence this question. Array formulas in Excel are used to perform multiple calculations on data items, allowing for a single result or multiple results. hey are capable of handling multiple values, doing complex calculations without the need for helper columns, dynamically adjusting to changes in the input range, and executing single formulas with multiple outcomes. They are especially helpful for matrix operations, dynamic filtering, and statistical analysis.
- Q13: How do you use the SUMIF function?
Users can sum values in a range based on a specified condition by using Excel's SUMIF function, which is a flexible tool for conditional summation. To sum values in particular ranges, it can be used with range, criteria, and [sum_range]. Examples include comparing blank or non-blank cells, utilizing operators and wildcards, and summing sales based on "Apples" in column A.
- Q14: Can you create a nested formula? Provide an example.
Excel's nested formulas enable several computations or logical operations to be performed inside of one formula. Use the IF and VLOOKUP functions, for instance, to classify products into "High," "Medium," or "Low" based on sales data. These powerful tools allow for complex calculations and logic in a single cell.
- Q15: How do you debug an error in an Excel formula?
Debugging Excel formula errors involves breaking down the formula, checking data types, using the Function Wizard, checking named ranges, searching online resources, re-creating the formula, using comments, and checking for circular references. You can also use formula auditing tools, evaluate the formula, review function arguments, and use the IFERROR function.
Advance excel interview questions on excel charts and graphs
- Q16: How do you customize charts in Excel?
Excel chart customization is an easy way to improve the data's visual appeal. Choose the appropriate data range, insert the chart type, and alter the title, axis titles, legend, data series color, labels, axis, and gridlines of the basic chart. Modify the chart area, add trendlines, and adjust the chart's layout and style. Save and distribute the chart, and look into more formatting and customization choices.
- Q17: Explain the steps to create a combination chart.
To create a combination chart in Excel, follow these steps:
- Prepare your data
- Select the data
- Insert a chart
- Choose chart types for each data series
- Adjust axis and formatting
- Customize data series
- Add data labels
- Add a secondary axis
- Finalize and save.
This allows you to represent different data sets using multiple chart types in a single visual.
- Q18: What are sparklines and how would you use them?
Excel sparkles are brief, pictorial charts that show data trends in a single cell. They can be used to display variations, patterns, and highs and lows. There are several varieties of them, including win/loss, column, and line. Select the cell, then pick the type, data range, and location range to insert a sparkline. Sparklines can be used in dashboards, in conjunction with data tables, and for rapid data visualization.
- Q19: How do you create a Gantt chart in Excel?
Use these steps to make a Gantt chart in Excel:
1) Gather your information, including the tasks, the start and end dates, and the duration estimate.
2) Add a stacked bar chart and make sure the task names, start and end dates, and duration are highlighted.
3) Modify the dates, duration, and color of the chart.
4) Overlay the chart and add benchmarks.
5) Complete and personalize the chart by adding labels, legends, color coding, titles, and a range of dates.
6) Store and distribute the chart for later use.
- Q20: Describe the process for creating a histogram.
A histogram is a graphical depiction of the distribution of a dataset that displays the frequency of data points within designated bins or intervals. To make one, use Excel's charting tools, create bins, and arrange your data. By changing the axis scaling, adding data labels, formatting, bin width, and formatting, you can personalize the histogram chart. Save and share the histogram for future reference and use it for data analysis and interpretation.
Advance Excel Interview Questions on PivotTables and PivotCharts
- Q21: How do you create a PivotChart in Excel?
Advance excel interview questions are never complete without this question. In order to make a PivotChart in Excel, arrange your data into a PivotTable, format and customize the appearance of the PivotTable, create a PivotTable, insert a PivotChart, select a chart type, and link the PivotChart to the PivotTable. Data analysis and visualization are made dynamic and interactive through this process.
- Q22: Explain how to group data in a PivotTable.
To group data in a PivotTable in Excel, create a range of cells, add fields to rows or columns, select a date or time field, right-click on the date field, specify grouping options, review the grouped data, expand or collapse groups, and modify or ungroup the grouping.
- Q23: Can you summarize data by categories using PivotTables?
In order to summarize data in Excel by category, first prepare your data. Then, make a PivotTable, design it, group and summarize the data by categories, add values to the Values area, adjust the formatting and appearance, and, if needed, refresh the data. Large volumes of data can be dynamically and easily presented in Excel with the help of pivot tables.
- Q24: How do you refresh a PivotTable?
You can manually refresh a PivotTable in Excel, or you can use keyboard shortcuts, automatic refresh, "Refresh All PivotTables," or refresh external data. These techniques guarantee that the PivotTable always shows the most recent information by reflecting the most recent data from the source. Excel offers several options to keep PivotTable data current
- Q25: What are calculated fields in PivotTables?
With calculated fields in pivot tables, users can build unique computations based on pre-existing data fields. You can define a field using mathematical operators or functions, add fields to the PivotTable, define the field using a calculated field, and then click "OK." The field can be used to change settings and show results. In a PivotTable context, these fields offer flexibility in analysis and insight generation.
Advance Excel Interview Questions on Macros and VBA
- Q26: What are macros and how do you create them in Excel?
Excel macros are sets of instructions that use the Visual Basic for Applications (VBA) programming language to automate tasks. They can be recorded or written manually, making data manipulation and analysis more efficient. Open the Developer Tab, record the macro, and execute commands to create it. Excel macros can be used to increase productivity and decrease errors, but they should be used with caution when executed from unidentified sources.
- Q27: How do you declare variables in VBA, and what are the different data types available?
Variables are used in Visual Basic for Applications (VBA) to store and manage data. Variables are used to reserve storage space and are declared using the Dim statement. Integers, longs, singles, doubles, strings, Booleans, dates, objects, variables, variables, currency, and decimals are examples of common data types. For clarity's sake, it is advised to use explicit data types to prevent unexpected behaviors. If necessary, variable data types can be applied.
- Q28: How do you protect your VBA code?
To protect your VBA code in Excel, follow these steps:
1. Protect the entire project with a password.
2. Compile the code by creating a VBA Add-In.
3. Use VBA code obfuscation by renaming variables and procedures.
4. Convert to binary format.
5. Distribute as an Add-In file.
6. Use third-party tools for enhanced protection.
Balancing security with practicality is crucial, and backups of unprotected code are essential.
- Q29: Explain the use of loops in VBA.
Loops are programming constructs in Visual Basic for Applications (VBA) that enable multiple code repetitions. There are basically four kinds: Nested Loops, For...Next, Do...Loop, and For Each...Next. For Each...Next loops iterate through elements in a collection; Nested Loops nest loops together; For...Next loops are used for predefined repetitions; and Do...Loops repeat code while a specified condition is true.
- Q30: How do you handle errors in VBA scripts?
This sums up our advance excel interview questions in this article. The On Error Statement, On Error Resume Next, On Error GoTo Label, Err Object, Err.Raise Method, Custom Error Handling, and Debugging Tools are some of the error-handling mechanisms used in VBA scripts. These methods permit script continuation, allow custom error-handling procedures, and enable or disable error handling. Errors during development can be found and fixed with the aid of debugging tools like the Immediate Window, stepping through code, and breakpoints.
Excel Best Practices
Excel is a powerful tool for managing data effectively. To maintain data integrity, use data validation to ensure only valid data is entered into cells. Protect cells and sheets with passwords to prevent accidental changes. Use tables to convert data ranges into Excel tables, use Excel's auditing tools to identify potential errors, and regularly check for errors. Organize data effectively with consistent naming conventions, descriptive headings, grouping and outlining, color coding, and hyperlinks. Optimize workbooks by limiting entire column/row references, minimizing volatile functions, using INDEX-MATCH instead of VLOOKUP, removing unnecessary formulas, using external data connections wisely, and optimizing images and objects.
Preparing for an Advanced Excel Interview
To prepare for an advanced Excel interview, understand the job requirements, practice common functions, demonstrate data analysis and visualization skills, master advanced formulas, master Power Query and Power Pivot, clean and validate data, automate tasks with VBA, prepare for scenario-based advance excel interview questions, and be comfortable with keyboard shortcuts. Make use of online courses, YouTube tutorials, Excel blogs, forums, books for further learning and master build on the advance excel interview questions in this article. Practice with real-world examples and mock interviews to solidify skills. Stay calm, communicate effectively, and articulate your Excel skills during the interview.
Conclusion
The significance of becoming proficient with Excel for data-driven decision-making is emphasized in the top 30 advanced interview questions in this article. Basic functions, VBA scripting, data manipulation, visualization, formula construction, and VBA automation are all covered in the advance excel interview questions. Candidates with this proficiency are valuable assets for organizations seeking efficiency and innovation.


