Introduction
Today’s business arena is a data driven one where deriving insight from a bunch of data is very crucial to business success. There are many tools and software available on the market for this yet power bi stands as an indispensable asset for most businesses due to its intuitive interface, robust functionality and its ability to integrate various data sources seamlessly. This has contributed to the surge in demand for skilled power bi professionals although thorough preparation is needed if you want to land a coveted power bi role in any organization.
Preparation sets candidates apart, equips them with the needed knowledge and confidence to excel in any interviews that come their way. Preparing for a Power BI interview involves a targeted approach, focusing on the most frequently asked and challenging power bi interview questions often posed by interviewers. Anticipating and mastering power bi interview questions is a leeway to confidently navigate the interview process while showcasing their expertise.
This is where this article comes in- addressing various aspects of frequently asked power bi interview questions, from basic concepts to advanced techniques to scenario-based questions to best practices and tips to ace your interview. The purpose of the article is to help candidates be well prepared through the top 25 Power bi Interview Questions and Answers in 2024, and through the knowledge, insights and strategies, enable them to navigate their power bi interviews confidently.
Understanding Power BI: A Primer for Job Seekers
A. What is Power BI and its role in Business Intelligence?
Before delving into our main power bi interview questions, we’ll have a look at these first. Created and maintained by Microsoft, power bi is a business intelligence tool that helps extract valuable insights from data to enable them make informed decisions which will drive business growth. Power bi helps organizations to connect to diverse data sources, clean, transform and shape raw data into suitable format for analysis, create data models and visually compelling and interactive reports. Real-time data monitoring, mobile accessibility, AI integration, security, and mobile accessibility are all made possible by Power BI. It is also a cost-effective solution.
B. The surge in Power BI's popularity in the job market
Anticipate power bi interview questions from this side. Power BI's popularity in the job market is driven by its robust capabilities in data visualization and analysis, seamless integration with Microsoft tools, user-friendly interface, robust data connectivity, strong community support, cost-effectiveness, wide range of applications, high demand for skilled professionals, empowerment of citizen data analysts, and continuous innovation. For companies looking for cost-effective solutions for data-driven decision-making, power bi's adaptability, affordability, and variety of uses make it a desirable option.
C. Core components of Power BI to be familiar with

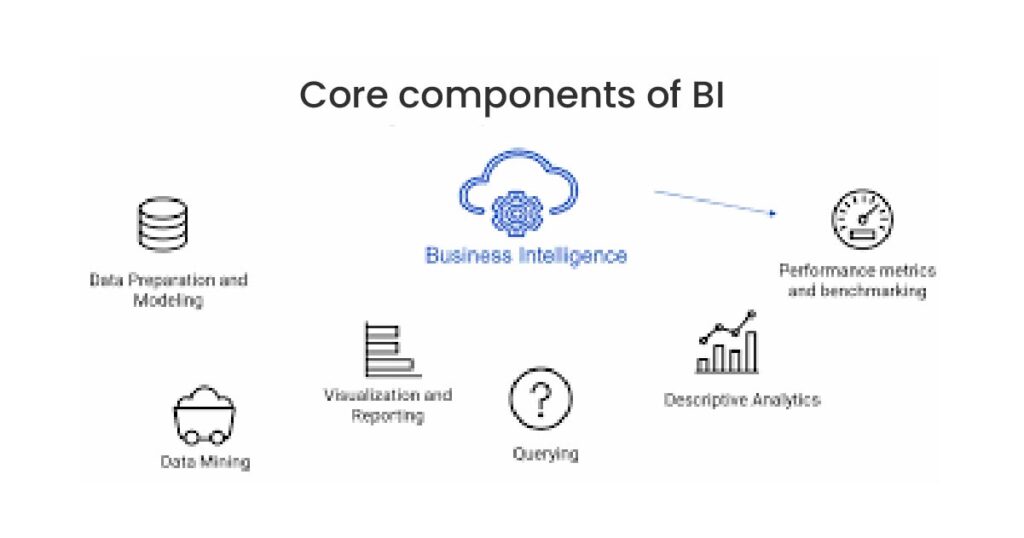
This is one of the curtain raiser power bi interview questions you can get. As a powerful data analysis tool, being familiar with its components is a step to becoming proficient with it. The core components include power query, Power View, Power Map, Power Q&A, Data Model, DAX, Power Pivot, Visualization Tools, Power BI Service, Power BI Gateway, and Power BI Mobile. These tools enable efficient data extraction, transformation, visualization, and sharing, enabling informed decision-making. Understanding and utilizing these components is crucial for effective data management.
The Basics: Entry-Level Power BI Interview Questions
A. Defining Power BI and its functionalities
This marks our first power bi interview questions in this article. Users can dynamically and interactively visualize and analyze data with Power BI, a business analytics tool from Microsoft. It connects to various data sources, including databases, spreadsheets, and web services, and provides tools for data preparation, transformation, and cleaning. Power BI offers a wide range of visualization options, including charts, graphs, maps, and tables. Users can create interactive reports by dragging and dropping fields onto the canvas, and create dashboards that provide a high-level overview of key metrics and KPIs. It also supports automatic data refreshes and natural language queries, allowing users to ask questions in plain English and generate visualizations based on the queried data. Power BI is mobile accessible, with a mobile app for iOS, Android, and Windows devices.
B. Differences between Power BI Desktop and Power BI Service

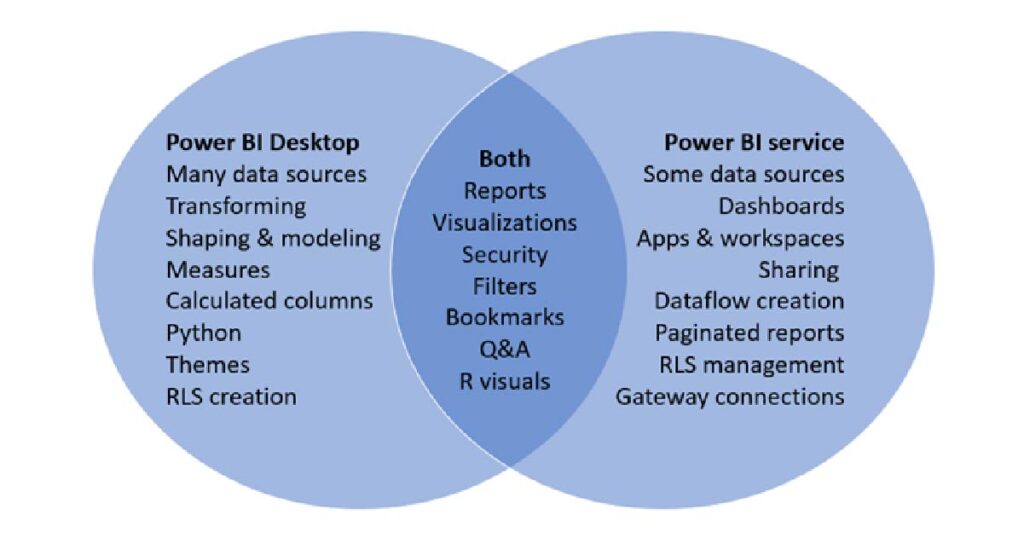
Power BI Service is a cloud-based platform hosted by Microsoft, whereas Power BI Desktop is a stand-alone application for creating and designing reports and dashboards. For various phases of data analysis and reporting, both are employed. While Power BI Service is a web-based platform that enables users to publish, share, and collaborate on Power BI content, Power BI Desktop is available for free download. Power BI Desktop is only available to users who share PBIX files manually or who work together on the same computer. It can only be accessed by any device that has an appropriate web browser. BI Service provides administrators with tools to manage access, permissions, and usage across the organization, as well as features for auditing and monitoring usage.
C. Data Importation: How Power BI connects to data sources

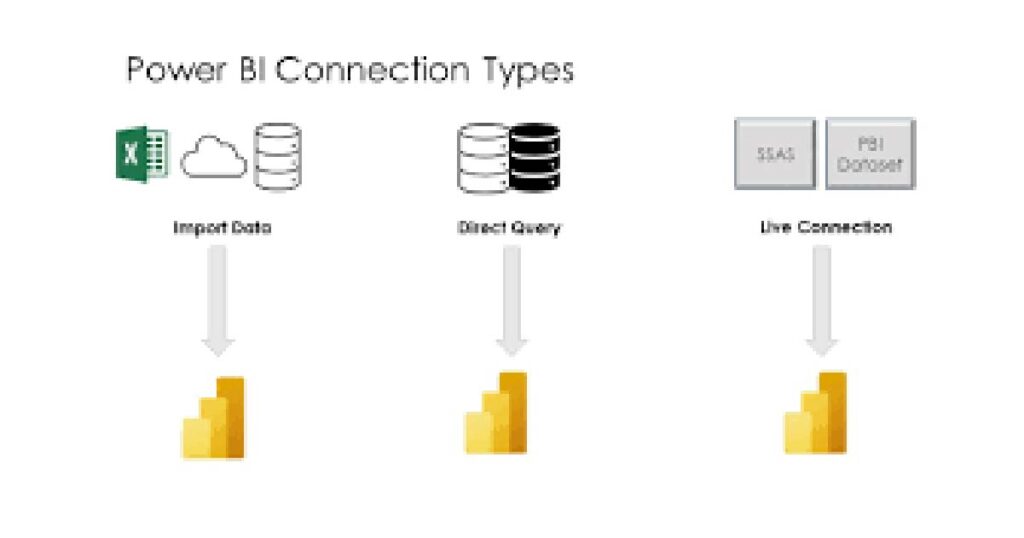
Power bi interview questions like this are to be expected. BI is a powerful tool for integrating and analyzing data from various sources, both on-premises and in the cloud. Its connectors enable users to connect to various data sources, including Excel, SQL Server, SharePoint, Salesforce, and Google Analytics. Multiple connection methods, such as DirectQuery, Import, and Composite, are supported by Power BI. It also provides tools for data preparation and transformation, data model creation, and scheduled data refreshes. Power Query M language for custom data transformations and Dataflows for cloud preparation and storage are examples of advanced data connectivity options. For safe connections to on-premises data sources, Power BI offers an On-Premises Data Gateway.
D. Data Transformation: Basics of Power Query
Before importing data into Power BI for analysis, users can carry out data transformation and preparation tasks using Power Query, an ETL tool in Power BI Desktop. It offers various functions such as filtering, removing columns, adding columns, changing data types, grouping and aggregating, merging and appending, pivoting and unpivoting, data cleaning, and custom transformations. In order to view the most recent information, users can schedule data refreshes, load transformed data, and preview changes in real-time.
E. Visualization Essentials: Understanding Power BI reports and dashboards
Power BI reports are visuals created using data from datasets, providing a detailed view and allowing users to interact with it. They are organized into report pages, with interactive elements like charts, graphs, and tables. Reports are drill-down, sliceable, and filterable. Users can navigate between key metrics and KPIs in Power BI dashboards, which are summarized views of the data. They are mobile-accessible, shareable, and dashboard and report-integrable. Both provide a comprehensive solution for data visualization and analysis.
Intermediate Insights: Mid-Level Power BI Interview Questions
A. DAX: The language of Power BI – Common functions and their uses
This lays the ground for our intermediate power bi interview questions. Power BI and other Microsoft products use the Data Analysis Expressions (DAX) formula language to carry out calculations and produce calculated columns and measures. DATESYTD/DATESQTD/DATESMTD, SUMX/AVERAGEX, RANKX, BLANK, USERELATIONSHIP, FILTER, RELATED, IF/ELSE/IFERROR, and CALCULATE are examples of common DAX functions. These functions enable complex calculations and analyses, making it essential to familiarize yourself with the functions most relevant to your specific data and analytical needs. DAX is a powerful tool with a wide range of functions that enable complex calculations and analyses.
B. Data Modeling in Power BI: Relationships, hierarchies, and tables
Data modeling is a crucial aspect of Power BI, involving organizing and structuring data for efficient analysis and visualization. Key components of data modeling include tables, which represent collections of related data, attributes and columns, and data types. Relationships define how tables in a data model are connected, allowing for seamless navigation and aggregation. There are several types of relationships, such as many-to-one, one-to-one, and many-to-many. Data is arranged into levels of detail, such as Year, Quarter, Month, and Day, using hierarchies. They can be made by right-clicking in a table to create a hierarchy after selecting related fields. New columns added to a table by defining a calculation based on preexisting columns are called calculated columns and measures.
C. Power BI Service Features: Sharing, collaboration, and content packs
A cloud-based platform called Power BI Service makes it easier to share, collaborate, and manage content for business intelligence solutions. Workspaces, content packs, sharing, permissions, security, and role-based access control are all included. Power BI Apps, which let users bundle and share datasets, reports, and dashboards, handle content management. The platform also supports scheduled data refreshments, on-premises data gateways, and app integration with Microsoft AppSource. It also provides usage metrics and auditing and integrates with other Microsoft services for enhanced productivity.
D. Security and Administration: Managing access and privacy in Power BI
More power bi interview questions can be anticipated around this. An effective tool for managing content and data inside an organization is Power BI. Workspace permissions, role-based access control, Azure Active Directory integration, and content-level security are some of its security features. Data protection is ensured through encryption, secure connections, and compliance with standards like GDPR, HIPAA, and ISO 27001. Additionally crucial are gateway management, content lifecycles, version histories, external sharing, and adherence to local data residency laws. Organizations can effectively manage access and privacy in Power BI by putting these measures into place.
Advanced Analytics: Senior-Level Power BI Interview Questions
A. Complex DAX queries and optimization techniques
Advanced DAX queries and optimization techniques are necessary for effective Power BI data analysis. These include Time Intelligence Functions like DATESYTD(), DATESQTD(), and DATEADD(), as well as advanced functions like Summarize(), Calculate() with ALL(), FILTER(), and VALUES(). Complex calculations become easier to read and manage when variables and VAR() are used. Users will only see pertinent data according to their role or group membership thanks to Row-Level Security (RLS). Reduce the number of calculated columns; use measures for aggregations; optimize DAX expressions; steer clear of the 'IN' operator; make good use of table relationships; use DirectQuery mode prudently; use aggregations (composite models); optimize data refresh; and index columns in source data are some examples of optimization techniques. Your dataset and reports' unique needs and characteristics should serve as a guide for optimization.
B. Advanced Data Modeling: Working with large datasets and performance tuning
To optimize performance in Power BI, consider using advanced data modeling techniques and performance tuning strategies. Using star or snowflake schema, data compression, partitioning, incremental refresh, relationship optimization, summary table creation, DAX performance optimization, cautious use of iterator functions, and data refresh strategies are a few of these. Performance Analyzer can be used for performance monitoring and profiling, and it is important to make sure Power Query operations are folded back into the original system. Large model support and aggregations for quicker queries on big datasets are two features of Power BI Premium. By improving source queries and indexing in source systems, indexing and source data optimization can be accomplished. After using these strategies, it's critical to benchmark and test performance while taking your dataset's unique requirements and features into account.
C. Power BI integration with other Microsoft services and APIs
Power BI offers seamless integration with Microsoft services and APIs, enhancing functionality and expanding data sources. Microsoft Dynamics 365, Outlook, Microsoft Excel, SharePoint, Teams, Azure Services, Microsoft Graph API, Power BI Service REST API, Power Query Custom Connectors, and Azure Machine Learning Studio are among the important integrations. With the help of these integrations, Power BI users can now take advantage of the whole range of Microsoft services, increase the number of data sources available, and improve teamwork.
D. Automation in Power BI: Understanding data refresh and gateways
Through data refresh and the use of gateways for on-premises data sources, Power BI automation makes sure that data is current and relevant in reports and dashboards. A scheduled, direct query, or live connection can be used to refresh data. Gateways connect to and refresh data behind the company's firewall, serving as a bridge between Power BI and on-premises data sources. Setting up and managing gateways is crucial for a seamless and reliable Power BI deployment. A dependable and current system requires proper configuration.
Real-World Scenarios: Problem-Solving Power BI Interview Questions
A. Case studies: Demonstrating problem-solving skills with Power BI
A retail company needs to analyze sales performance to identify trends, optimize inventory levels, and improve profitability. The challenge lies in diverse data sources, extensive cleaning, and multi-level analysis. The solution involves using Power BI Desktop to integrate data from various sources, cleaning and transforming data, creating a star schema data model, defining key performance indicators (KPIs), designing a Power BI report with visuals, and implementing drill-down functionality to provide detailed insights.
B. Troubleshooting common Power BI issues
Data connection problems, data refresh problems, DAX expression errors, slow performance, incorrectly rendered visualizations, problems with access and permissions, gateway problems, and problems with report design and layout are some of the common problems that can arise with Power BI. Use tools like Power Query in Power BI Desktop to confirm network/firewall settings, double-check credentials, and test data source connections in order to fix these problems. To make sure the Power BI service has access to the data source, check the gateway status, availability, and data source settings. To achieve desired results, double-check the DAX syntax and make sure the functions are used in the right context.
C. Performance optimization: Best practices for efficient report design
This is one of the most likely power bi interview questions. Power BI reports must be designed efficiently if they are to load rapidly, function flawlessly, and offer a seamless user experience. A few examples of best practices are utilizing aggregations, testing performance, maximizing Power BI Service features, avoiding complex relationships, optimizing the data model, limiting data load, optimizing DAX expressions, limiting visualizations, minimizing custom visuals, optimizing data refresh, and optimizing for mobile devices.
D. Predictive Analysis: Incorporating AI and machine learning into Power BI
Incorporating AI and machine learning into Power BI allows for predictive analytics, enabling businesses to make informed decisions based on data-driven forecasts. Choose a good machine learning model, train it, make predictions, and configure an API in order to integrate. Link Power BI to the model, incorporate forecasts into reports, assess and track performance, employ AI visualizations, take into account outside AI services, manage real-time data, and guarantee data privacy and compliance.
The Soft Skills: Behavioral Questions Related to Power BI Roles
A. Communication: Explaining complex data to non-technical stakeholders
Adapt your communication style, use plain language, tell a story, visualize data effectively, provide context, concentrate on key messages, use analogies and metaphors, break down complex concepts, ask questions, give real-world examples, use analogous visualizations, provide hands-on demonstrations, avoid overloading information, get feedback, and follow up with documentation if you want to communicate complex data to non-technical stakeholders.
B. Teamwork: Collaborating on projects with cross-functional teams
Effective cross-functional teamwork is crucial for successful outcomes. Clear roles and objectives, a shared vision, frequent communication, productive meetings, the use of collaboration tools, respect for different viewpoints, trust-building, explicit expectations, constructive conflict resolution, achievement celebration, opportunities for cross-training, encouragement of a culture of continuous learning, feedback loops, documentation and information sharing, and flexibility and adaptability are some strategies.
C. Time Management: Prioritizing tasks in a dynamic work environment
Define your goals, use the Eisenhower Matrix, think about impact, set deadlines, apply the 80/20 Rule, think about dependencies, delegate when you can, avoid multitasking, use a task management tool, regularly reevaluate priorities, apply the Two-Minute Rule, practice saying no, set aside time blocks for in-depth work, keep a "Not To-Do" list, and take care of yourself. Remember that effective prioritization is a skill that does not develop overnight.
D. Continuous Learning: Keeping up with Power BI updates and new features
The following tactics will help you get the most out of Power BI: subscribe to official channels, join community forums, follow Power BI experts, sign up for online courses, read books, watch webinars, play around with the service, sign up for newsletters, make use of preview features, join early adoption programs, schedule time specifically for learning, record and utilize new features, participate in online communities, and pay attention to Microsoft's release notes.
Beyond the Interview: Preparing for a Career in Power BI
The following actions can help you get ready for a career in Power BI: get official certifications; sign up for webinars and workshops; take online courses; create a portfolio; keep abreast of industry developments; join associations for professionals; and network with other experts.
Conclusion
We have seen a number of the top power bi interview questions and corresponding answers to them in this article. Candidates who are adept at answering these power bi interview questions will be able to move through the interview process with confidence, showcasing their capacity to evaluate data, produce perceptive visualizations, and use Power BI to make well-informed business decisions. Remember, in interviews, power bi interview questions are asked based on the discretion of the interviewer, so it is up to the candidate to make the best of the opportunity they have been given to showcase their expertise.


